Statistics
Statistics is where consistency becomes something you can see. Every task has its own statistics screen showing how faithfully you’ve kept it — your streaks, this week at a glance, and a calendar of every day since you started.
To open it, go to Today and tap a task’s card (anywhere except the checkbox). The statistics open as a panel you can read through and swipe down to dismiss. Everything here is read-only — it’s a picture of your history, not somewhere you check tasks off.
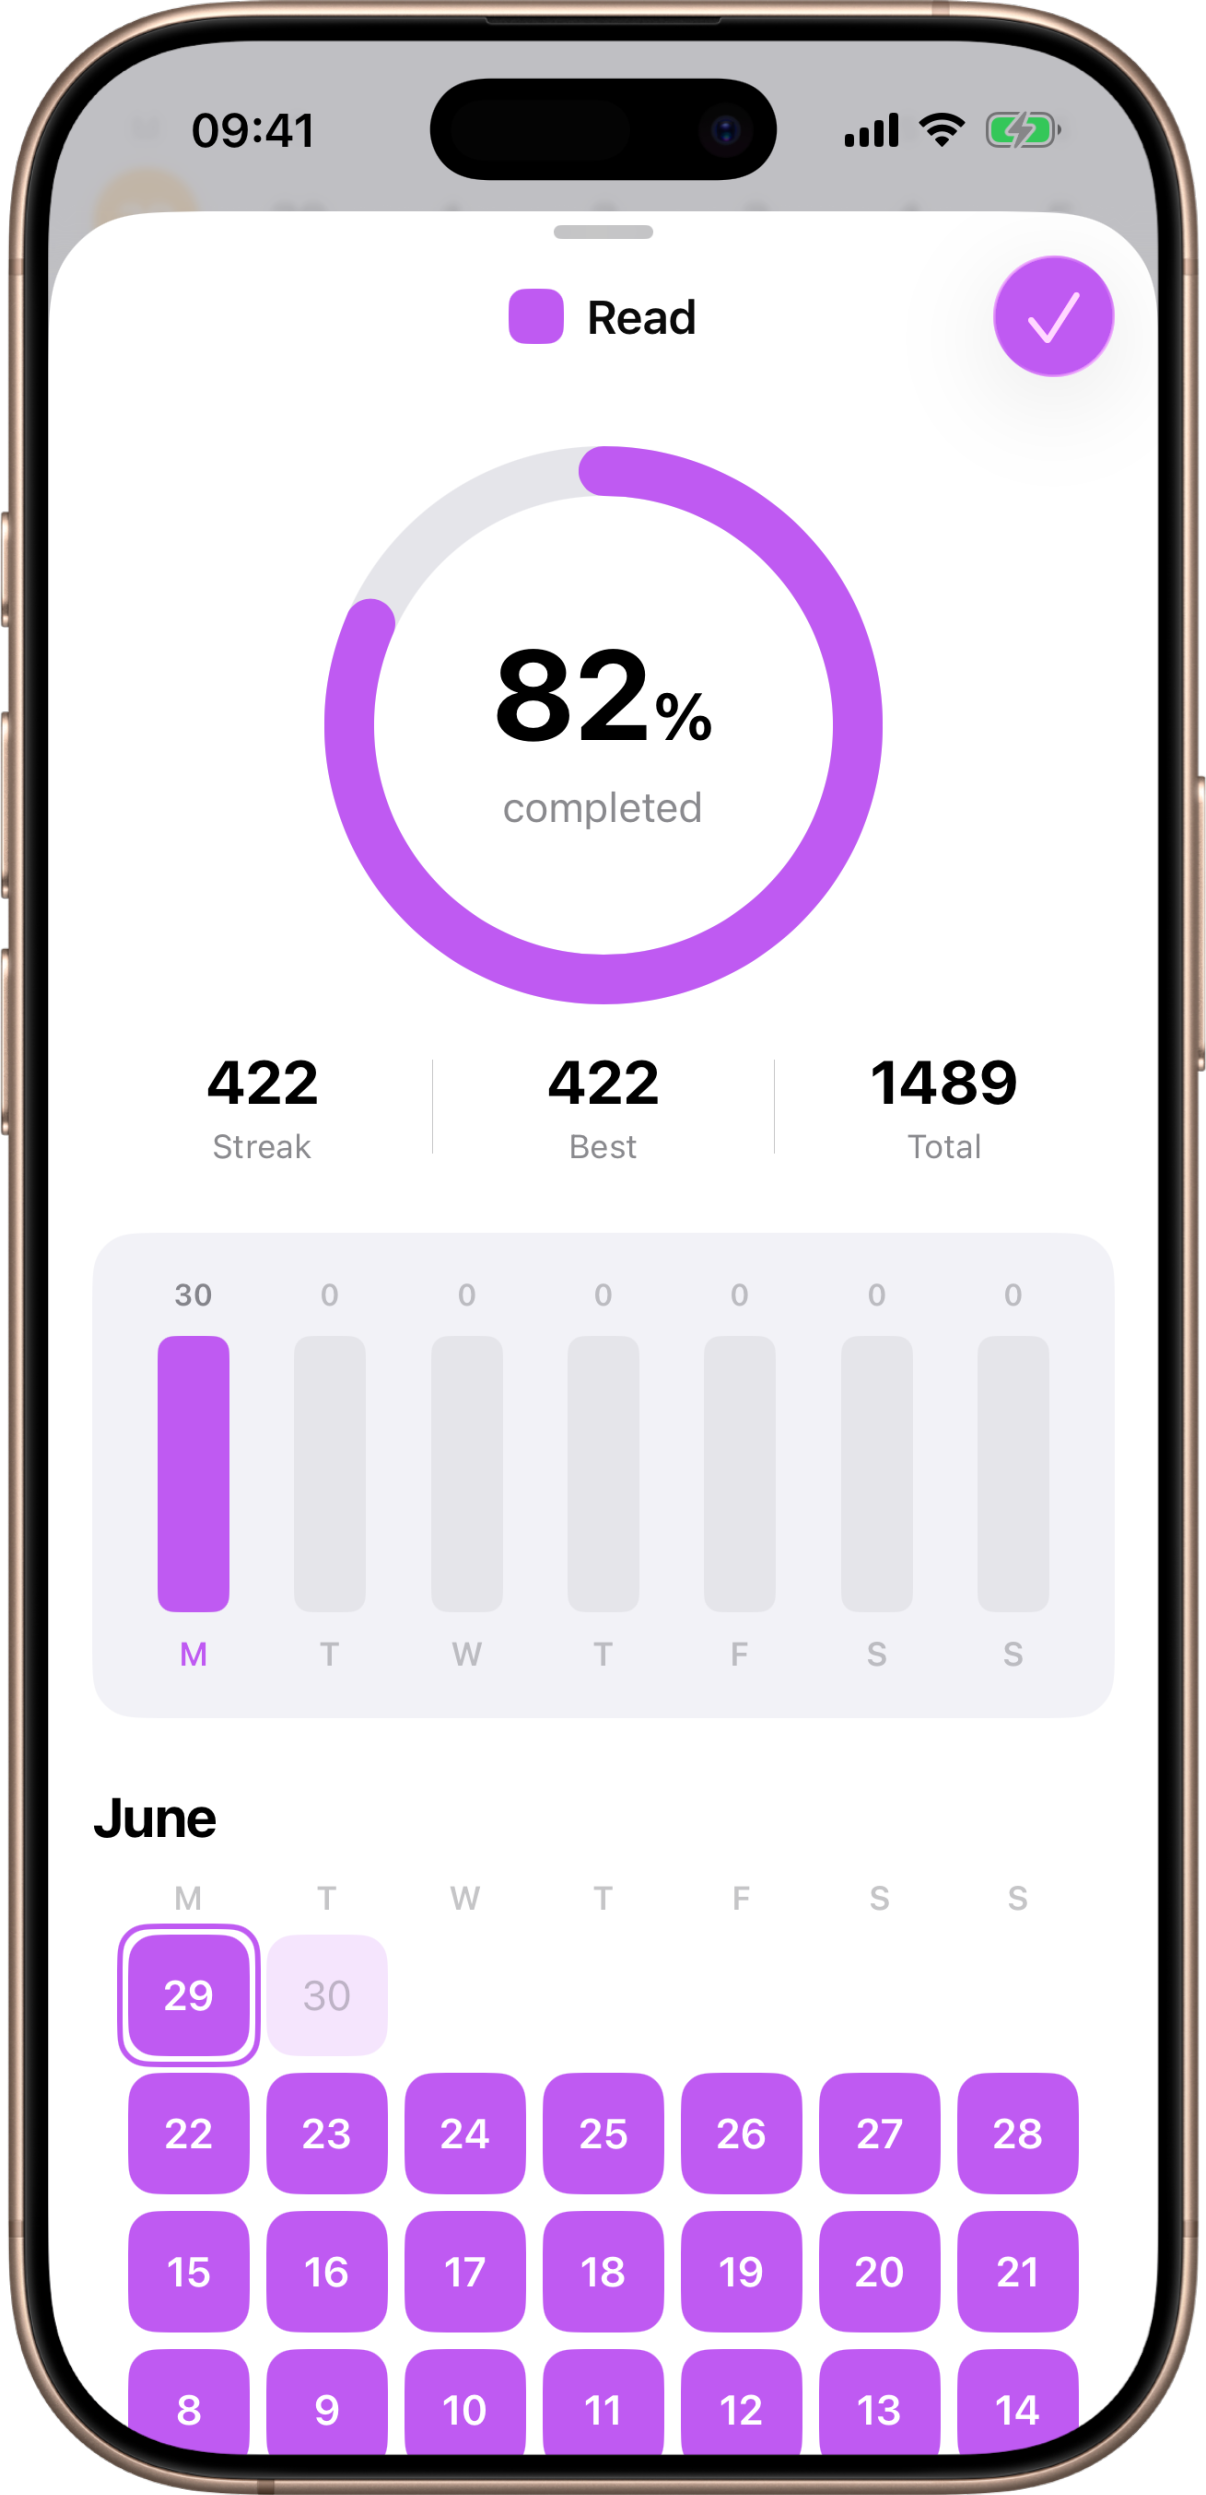
The completion ring
At the top is a large ring showing your completion rate as a percentage — how many of the task’s active days you’ve actually completed, from the day it started through today. A day the task wasn’t active yet doesn’t count against you.
Streak, Best, and Total
Just below the ring are three numbers:
- Streak — your current run: how many days in a row you’ve kept the task, counting back from today.
- Best — the longest run of consecutive days you’ve ever kept it.
- Total — the total number of days you’ve completed the task, all-time.
Unlike the streak shown on Today (which tops out at “1 year+”), the number here is always exact, however long your run.
This week
A “This Week” strip shows the current week at a glance, and it adapts to the task’s type:
- Simple tasks show a pill for each day — a filled checkmark for a day you completed, an outlined day-number for a day you missed, and a faint number for days the task wasn’t active. Today’s pill is ringed in the task’s color.
- Counter tasks show a small bar chart — one bar per day, filled in proportion to the number you logged, with that day’s value printed above it.
Insights (counter tasks)
Under the week strip, a counter task also gets an Insights card — “Charts and trends over time”, with a small preview of your last two weeks. Tap it to open the full chart of everything you’ve logged, by day, week or month, plus a read on whether you’ve been doing more or less lately. See Insights for the whole screen.
The history calendar
Below the week strip is your full history as a stack of month calendars, newest first.
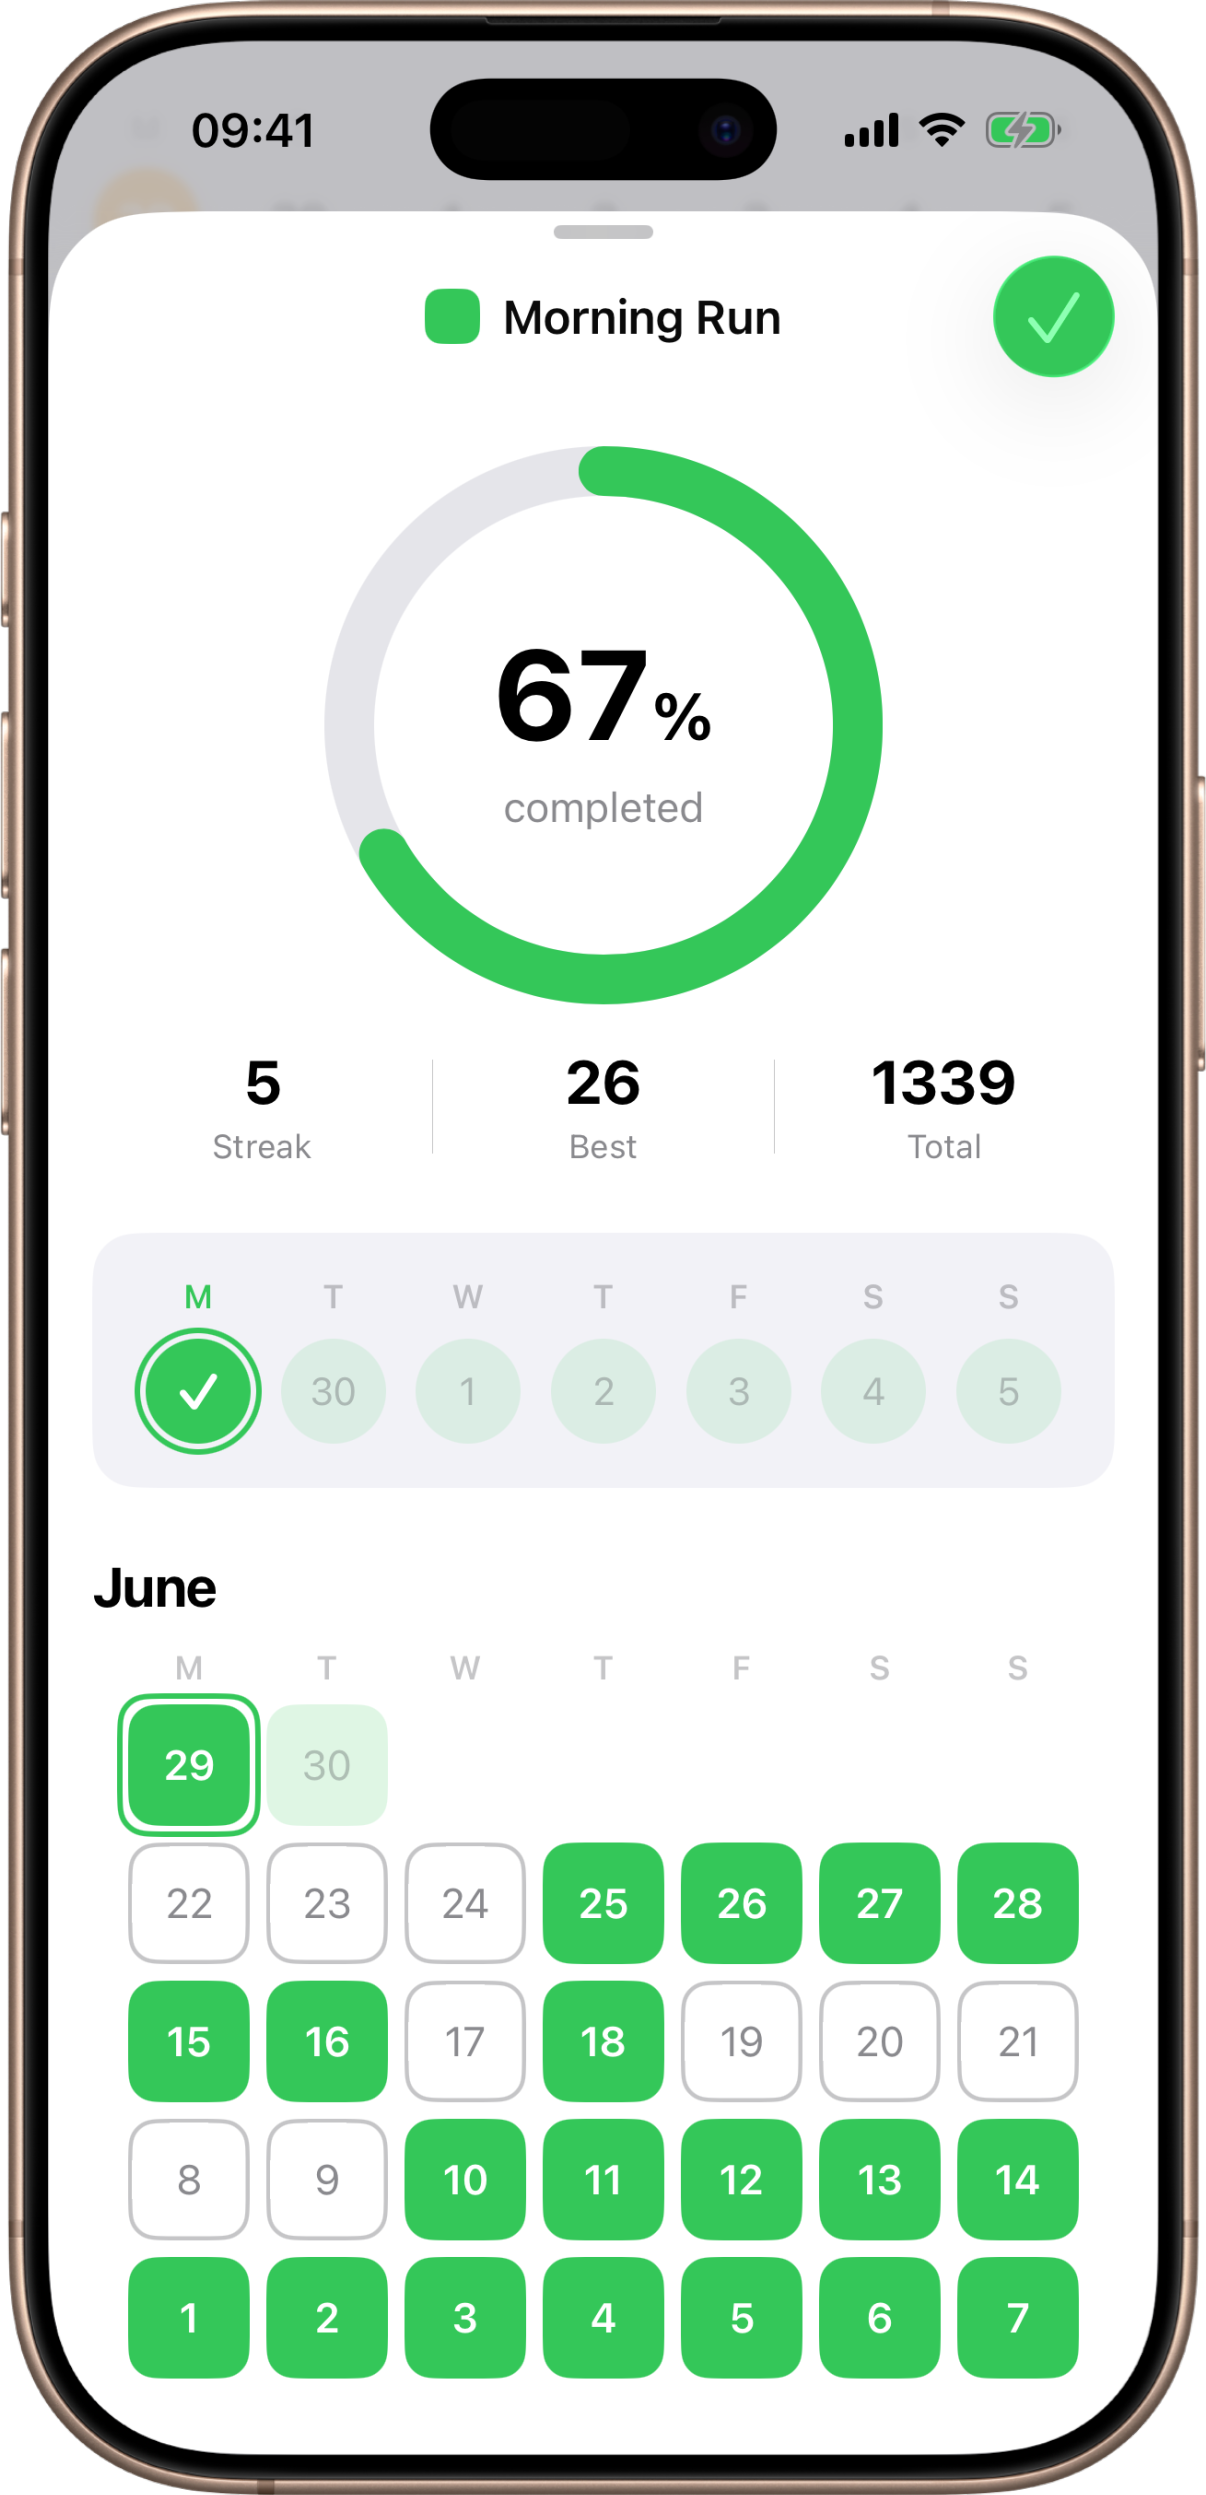
Each day is a small square:
- Filled (in the task’s color, with a white day number) — completed.
- Outlined — an active day you missed.
- Faint tinted — a day outside the task’s active window: before it started, after it was archived, or still in the future.
Today’s square is marked with a ring. A short legend at the bottom — Done, Missed, Not applicable — recaps what each square means.